Functional scores of variants for viral entry
This notebook analyzes the functional scores, which are effects of mutations on viral entry: positive values indicate better entry, negative values worse entry.
[1]:
import math
import os

import altair as alt

import dms_variants.codonvarianttable

import numpy

import pandas as pd

import plotnine as p9

import scipy.stats

import yaml
[2]:
# allow more rows for Altair
_ = alt.data_transformers.disable_max_rows()
Get configuration information:
[3]:
# If you are running notebook interactively rather than in pipeline that handles
# working directories, you may have to first `os.chdir` to appropriate directory.

with open("config.yaml") as f:
    config = yaml.safe_load(f)
Read functional selections and functional scores
Get the functional selections data frame:
[4]:
functional_selections = pd.read_csv(config["functional_selections"])
Read in the functional scores:
[5]:
func_scores = pd.concat(
    [
        pd.read_csv(
            os.path.join(config["func_score_dir"], f"{selection_name}_func_scores.csv"),
            na_filter=False,
        )
        for selection_name in functional_selections["selection_name"]
    ],
    ignore_index=True,
)

assert len(func_scores) == len(func_scores.drop_duplicates())
Variants with sufficient pre-selection counts
We will eventually only analyze the functional scores for variants with some minimum threshold of pre-selection counts.
Draw a boxplot for the pre-selection samples with a black line at the median, boxes spanning the 25th to 75th percentiles, lines spanning the minimum to the maximum, and a red line indciating the threshold. You can mouseover bars for details and use the dropdown selections to just show certain subsets. Note that y-axis uses a symlog scale:
[6]:
# get data to plot
preselection_count_boxplot_df = (
    func_scores[
        [
            "library",
            "pre_sample",
            "pre_count",
            "barcode",
            "pre_count_threshold",
        ]
    ]
    .drop_duplicates()
    .assign(
        variant_above_threshold=lambda x: (
            x["pre_count"] >= x["pre_count_threshold"]
        ).astype(int),
        count_above_threshold=lambda x: x["pre_count"] * x["variant_above_threshold"],
    )
    .groupby(["library", "pre_sample", "pre_count_threshold"], as_index=False)
    .aggregate(
        median=pd.NamedAgg("pre_count", "median"),
        percentile_25=pd.NamedAgg("pre_count", lambda s: s.quantile(0.25)),
        percentile_75=pd.NamedAgg("pre_count", lambda s: s.quantile(0.75)),
        min=pd.NamedAgg("pre_count", "min"),
        max=pd.NamedAgg("pre_count", "max"),
        nvariants=pd.NamedAgg("barcode", "count"),
        total_counts=pd.NamedAgg("pre_count", "sum"),
        variants_above_threshold=pd.NamedAgg("variant_above_threshold", "sum"),
        counts_above_threshold=pd.NamedAgg("count_above_threshold", "sum"),
    )
    .assign(
        library_sample=lambda x: x["library"] + " " + x["pre_sample"],
        frac_counts_above_threshold=lambda x: x["counts_above_threshold"]
        / x["total_counts"],
        frac_variants_above_threshold=lambda x: x["variants_above_threshold"]
        / x["nvariants"],
    )
    .drop(
        columns=[
            "counts_above_threshold",
            "variants_above_threshold",
            "total_counts",
            "nvariants",
        ]
    )
    .merge(
        functional_selections.rename(columns={"preselection_sample": "pre_sample"})[
            ["pre_sample", "virus_batch", "library"]
        ].drop_duplicates(),
        how="left",
        validate="one_to_one",
    )
)
assert (
    len(preselection_count_boxplot_df)
    == preselection_count_boxplot_df["library_sample"].nunique()
)

# make plot
preselection_count_base = alt.Chart(preselection_count_boxplot_df).encode(
    y=alt.Y("library_sample", title=None),
    tooltip=[
        alt.Tooltip(c, format=".2g")
        if preselection_count_boxplot_df[c].dtype == float
        else c
        for c in preselection_count_boxplot_df.columns
        if c != "library_sample"
    ],
)

preselection_count_quartile_bars = preselection_count_base.encode(
    alt.X(
        "percentile_25",
        scale=alt.Scale(type="symlog", constant=20),
        title="counts for variant",
    ),
    alt.X2("percentile_75"),
).mark_bar(color="blue")

preselection_count_range_lines = preselection_count_base.encode(
    alt.X("min"),
    alt.X2("max"),
).mark_rule(color="blue", opacity=0.5)

preselection_count_median_lines = preselection_count_base.encode(
    alt.X("median"), alt.X2("median")
).mark_bar(xOffset=1, x2Offset=-1, color="black")

preselection_count_threshold = preselection_count_base.encode(
    alt.X("pre_count_threshold"), alt.X2("pre_count_threshold")
).mark_bar(xOffset=1, x2Offset=-1, color="red")

preselection_count_chart = (
    (
        preselection_count_quartile_bars
        + preselection_count_range_lines
        + preselection_count_median_lines
        + preselection_count_threshold
    )
    .configure_axis(labelLimit=500)
    .properties(width=350, height=alt.Step(14))
)

# set up selections over other columns of interest
selection_names = ["library", "virus_batch"]
selections = [
    alt.selection_point(
        fields=[col],
        bind=alt.binding_select(
            options=[None] + functional_selections[col].unique().tolist(),
            labels=["all"] + [str(x) for x in functional_selections[col].unique()],
            name=col,
        ),
    )
    for col in selection_names
]

# add selections
for s, name in zip(selections, selection_names):
    if name != "antibody":
        preselection_count_chart = preselection_count_chart.add_parameter(
            s
        ).transform_filter(s)

preselection_count_chart
/fh/fast/bloom_j/software/miniconda3/envs/dms-vep-pipeline/lib/python3.10/site-packages/altair/utils/core.py:317: FutureWarning: iteritems is deprecated and will be removed in a future version. Use .items instead.
[6]:
Plot the fraction of all variants, and fraction of all counts, that are above the thresholds for the pre-selection samples:
[7]:
frac_counts_df = preselection_count_boxplot_df.drop(
    columns=[
        "median",
        "pre_count_threshold",
        "min",
        "max",
        "percentile_25",
        "percentile_75",
    ],
).rename(
    columns={
        "frac_counts_above_threshold": "counts",
        "frac_variants_above_threshold": "variants",
    }
)

fraction_type_selection = alt.selection_point(
    fields=["fraction_type"],
    bind="legend",
)

frac_counts_chart = (
    alt.Chart(frac_counts_df)
    .transform_fold(fold=["counts", "variants"], as_=["fraction_type", "fraction"])
    .encode(
        y=alt.Y("library_sample", title=None),
        tooltip=[
            alt.Tooltip(c, format=".2g") if frac_counts_df[c].dtype == float else c
            for c in frac_counts_df.columns
            if c != "library_sample"
        ],
        x=alt.X(
            "fraction:Q",
            title="fraction above threshold",
            scale=alt.Scale(domain=(0, 1)),
        ),
        color=alt.Color(
            "fraction_type:N",
            title=None,
            scale=alt.Scale(domain=["counts", "variants"]),
        ),
    )
    .mark_point(filled=True, size=50)
    .properties(width=200, height=alt.Step(14))
    .configure_axis(labelLimit=500)
    .add_selection(fraction_type_selection)
    .transform_filter(fraction_type_selection)
)

for s in selections:
    frac_counts_chart = frac_counts_chart.add_selection(s).transform_filter(s)

frac_counts_chart
/fh/fast/bloom_j/software/miniconda3/envs/dms-vep-pipeline/lib/python3.10/site-packages/altair/utils/core.py:317: FutureWarning: iteritems is deprecated and will be removed in a future version. Use .items instead.
[7]:
Now just get the functional scores for variant with sufficient pre-selection counts:
[8]:
func_scores_filtered = func_scores.query("pre_count >= pre_count_threshold")
Distributions of functional scores
Plot the distribution of functional scores. These plots are most informative if we classify variants by the “types” of mutations they have, which we do here using the CodonVariantTable.classifyVariants method, which adds a column called variant_class to the data frame:
[9]:
func_scores_filtered = (
    func_scores_filtered.rename(
        columns={"aa_substitutions_sequential": "aa_substitutions"}
    )
    .pipe(dms_variants.codonvarianttable.CodonVariantTable.classifyVariants)
    .rename(columns={"aa_substitutions": "aa_substitutions_sequential"})
)
Also annotate variants by whether they have only intended amino acid substitutions or some that are unintended (not in the designed mutations):
[10]:
# read designed amino-acid mutations
designed_aas = set(
    pd.read_csv(config["mutation_design_classification"]).assign(
        aa=lambda x: x["sequential_site"].astype(str) + x["amino_acid"]
    )["aa"]
)

func_scores_filtered = func_scores_filtered.assign(
    has_unintended_aa_mut=lambda x: x["aa_substitutions_sequential"].map(
        lambda s: any(m[1:] not in designed_aas for m in s.split() if s)
    ),
)
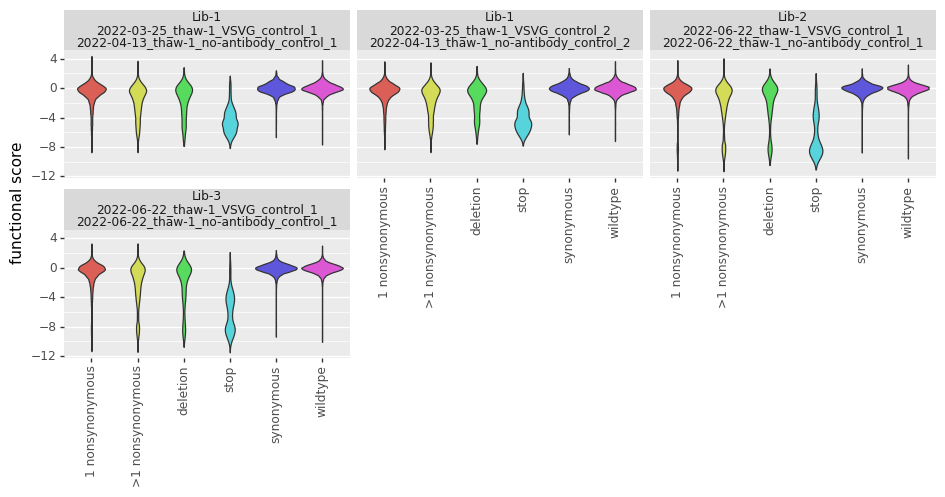
Now we use plotnine to plot the distributions of scores in ggplot2-like syntax, coloring by the variant class. This plot shows the expected behavior for different variant classes; for instance, stop codon variants tend to have low scores and synonymous variants tend to have wildtype-like (near 0) scores. As expected, there is more noise with a tighter bottleneck:
[11]:
ncols = 3
nrows = math.ceil(
    len(func_scores_filtered.groupby(["library", "pre_sample", "post_sample"])) / ncols
)

p = (
    p9.ggplot(func_scores_filtered, p9.aes("variant_class", "func_score"))
    + p9.geom_violin(p9.aes(fill="variant_class"))
    + p9.ylab("functional score")
    + p9.xlab("")
    + p9.facet_wrap("~ library + pre_sample + post_sample", ncol=ncols)
    + p9.theme(
        figure_size=(3.75 * ncols, 2 * nrows),
        axis_text_x=p9.element_text(angle=90),
        panel_grid_major_x=p9.element_blank(),  # no vertical grid lines
    )
    + p9.scale_fill_discrete(guide=False)
)
_ = p.draw()
Now plot distribution of functional scores in a ridgeplot using altair, this time faceting just by library (averaging all replicates within a library):
[12]:
def ridgeplot(df):
    # get smoothed distribution of functional scores
    bins = numpy.linspace(
        df["func_score"].min(),
        df["func_score"].max(),
        num=50,
    )
    smoothed_dist = pd.concat(
        [
            pd.DataFrame(
                {
                    "library": lib,
                    "variant_class": var,
                    "func_score": bins,
                    "count": scipy.stats.gaussian_kde(df["func_score"])(bins),
                    "mean_func_score": df["func_score"].mean(),
                }
            )
            for (lib, var), df in df.groupby(["library", "variant_class"])
        ]
    )

    # ridgeline plot: https://altair-viz.github.io/gallery/ridgeline_plot.html
    facet_height = 27
    facet_overlap = 0.7
    ridgeline_chart = (
        alt.Chart(smoothed_dist)
        .encode(
            x=alt.X(
                "func_score", title="functional score", scale=alt.Scale(nice=False)
            ),
            y=alt.Y(
                "count",
                axis=None,
                scale=alt.Scale(range=[facet_height, -facet_overlap * facet_height]),
            ),
            fill=alt.Fill(
                "mean_func_score:Q",
                title="mean functional score",
                legend=alt.Legend(direction="horizontal"),
                scale=alt.Scale(scheme="yellowgreenblue"),
            ),
            row=alt.Row(
                "variant_class",
                title=None,
                header=alt.Header(labelAlign="left", labelAngle=0),
                spacing=0,
                sort=[
                    "wildtype",
                    "synonymous",
                    "1 nonsynonymous",
                    ">1 nonsynonymous",
                    "deletion",
                    "stop",
                ],
            ),
            column=alt.Column(
                "library",
                title=None,
                header=alt.Header(
                    labelFontWeight="bold",
                    labelPadding=facet_height * facet_overlap,
                ),
            ),
            tooltip=[
                "library",
                "variant_class",
                alt.Tooltip(
                    "mean_func_score", format=".2f", title="mean functional score"
                ),
            ],
        )
        .mark_area(
            interpolate="monotone",
            smooth=True,
            fillOpacity=0.8,
            stroke="lightgray",
            strokeWidth=0.5,
        )
        .configure_view(stroke=None)
        .configure_axis(grid=False)
        .properties(width=200, height=facet_height, bounds="flush")
    )

    return ridgeline_chart


ridgeplot(func_scores_filtered)
/fh/fast/bloom_j/software/miniconda3/envs/dms-vep-pipeline/lib/python3.10/site-packages/altair/utils/core.py:317: FutureWarning: iteritems is deprecated and will be removed in a future version. Use .items instead.
[12]:
If there are variant classes with both intended and unintended amino-acid mutations, also make a ridgeplot of those:
[13]:
reassign_variant_class = (
    func_scores_filtered[["variant_class", "has_unintended_aa_mut"]]
    .drop_duplicates()
    .assign(
        both=lambda x: (
            x.groupby("variant_class")["has_unintended_aa_mut"].transform("nunique") > 1
        ),
        reassigned_variant_class=lambda x: x.apply(
            lambda r: (
                r["variant_class"]
                if not r["both"]
                else (
                    r["variant_class"] + " with unintended mutations"
                    if r["has_unintended_aa_mut"]
                    else r["variant_class"] + " all intended mutations"
                )
            ),
            axis=1,
        ),
    )
)

if len(reassign_variant_class) > func_scores_filtered["variant_class"].nunique():
    intended_df = (
        func_scores_filtered.merge(
            reassign_variant_class,
            on=["variant_class", "has_unintended_aa_mut"],
            validate="many_to_one",
        )
        .drop(columns=["variant_class", "both", "has_unintended_aa_mut"])
        .rename(columns={"reassigned_variant_class": "variant_class"})
    )
    display(
        intended_df.groupby(["variant_class", "library"]).aggregate(
            n_variants=pd.NamedAgg("barcode", "count")
        )
    )
    display(ridgeplot(intended_df))
else:
    print("No variant class with both intended and unintended amino-acid mutations")
| n_variants | ||
|---|---|---|
| variant_class | library | |
| 1 nonsynonymous all intended mutations | Lib-1 | 47947 |
| Lib-2 | 35633 | |
| Lib-3 | 32256 | |
| 1 nonsynonymous with unintended mutations | Lib-1 | 2405 |
| Lib-2 | 1774 | |
| Lib-3 | 1772 | |
| >1 nonsynonymous all intended mutations | Lib-1 | 82034 |
| Lib-2 | 60036 | |
| Lib-3 | 50832 | |
| >1 nonsynonymous with unintended mutations | Lib-1 | 12674 |
| Lib-2 | 8969 | |
| Lib-3 | 8428 | |
| deletion all intended mutations | Lib-1 | 1976 |
| Lib-2 | 1434 | |
| Lib-3 | 1140 | |
| deletion with unintended mutations | Lib-1 | 360 |
| Lib-2 | 290 | |
| Lib-3 | 229 | |
| stop | Lib-1 | 3127 |
| Lib-2 | 2401 | |
| Lib-3 | 2341 | |
| synonymous | Lib-1 | 5013 |
| Lib-2 | 3785 | |
| Lib-3 | 3528 | |
| wildtype | Lib-1 | 25802 |
| Lib-2 | 19618 | |
| Lib-3 | 18059 |
/fh/fast/bloom_j/software/miniconda3/envs/dms-vep-pipeline/lib/python3.10/site-packages/altair/utils/core.py:317: FutureWarning: iteritems is deprecated and will be removed in a future version. Use .items instead.
Correlations in variant-level functional scores
Analyze correlations of escape probabilities of different variants in same library:
[14]:
corrs = (
    dms_variants.utils.tidy_to_corr(
        df=func_scores_filtered.assign(
            sample=lambda x: x["pre_sample"] + " vs " + x["post_sample"],
        ),
        sample_col="sample",
        label_col="barcode",
        value_col="func_score",
        group_cols="library",
    )
    .assign(r2=lambda x: x["correlation"] ** 2)
    .drop(columns="correlation")
)

for library, library_corr in corrs.groupby("library"):
    corr_chart = (
        alt.Chart(library_corr)
        .encode(
            alt.X("sample_1", title=None),
            alt.Y("sample_2", title=None),
            color=alt.Color("r2", scale=alt.Scale(zero=True)),
            tooltip=[
                alt.Tooltip(c, format=".3g") if c == "r2" else c
                for c in ["library", "sample_1", "sample_2", "r2"]
            ],
        )
        .mark_rect(stroke="black")
        .properties(width=alt.Step(15), height=alt.Step(15), title=library)
        .configure_axis(labelLimit=500)
    )

    display(corr_chart)
/fh/fast/bloom_j/software/miniconda3/envs/dms-vep-pipeline/lib/python3.10/site-packages/dms_variants/utils.py:360: FutureWarning: The default value of numeric_only in DataFrameGroupBy.corr is deprecated. In a future version, numeric_only will default to False. Either specify numeric_only or select only columns which should be valid for the function.
/fh/fast/bloom_j/software/miniconda3/envs/dms-vep-pipeline/lib/python3.10/site-packages/altair/utils/core.py:317: FutureWarning: iteritems is deprecated and will be removed in a future version. Use .items instead.
[ ]: