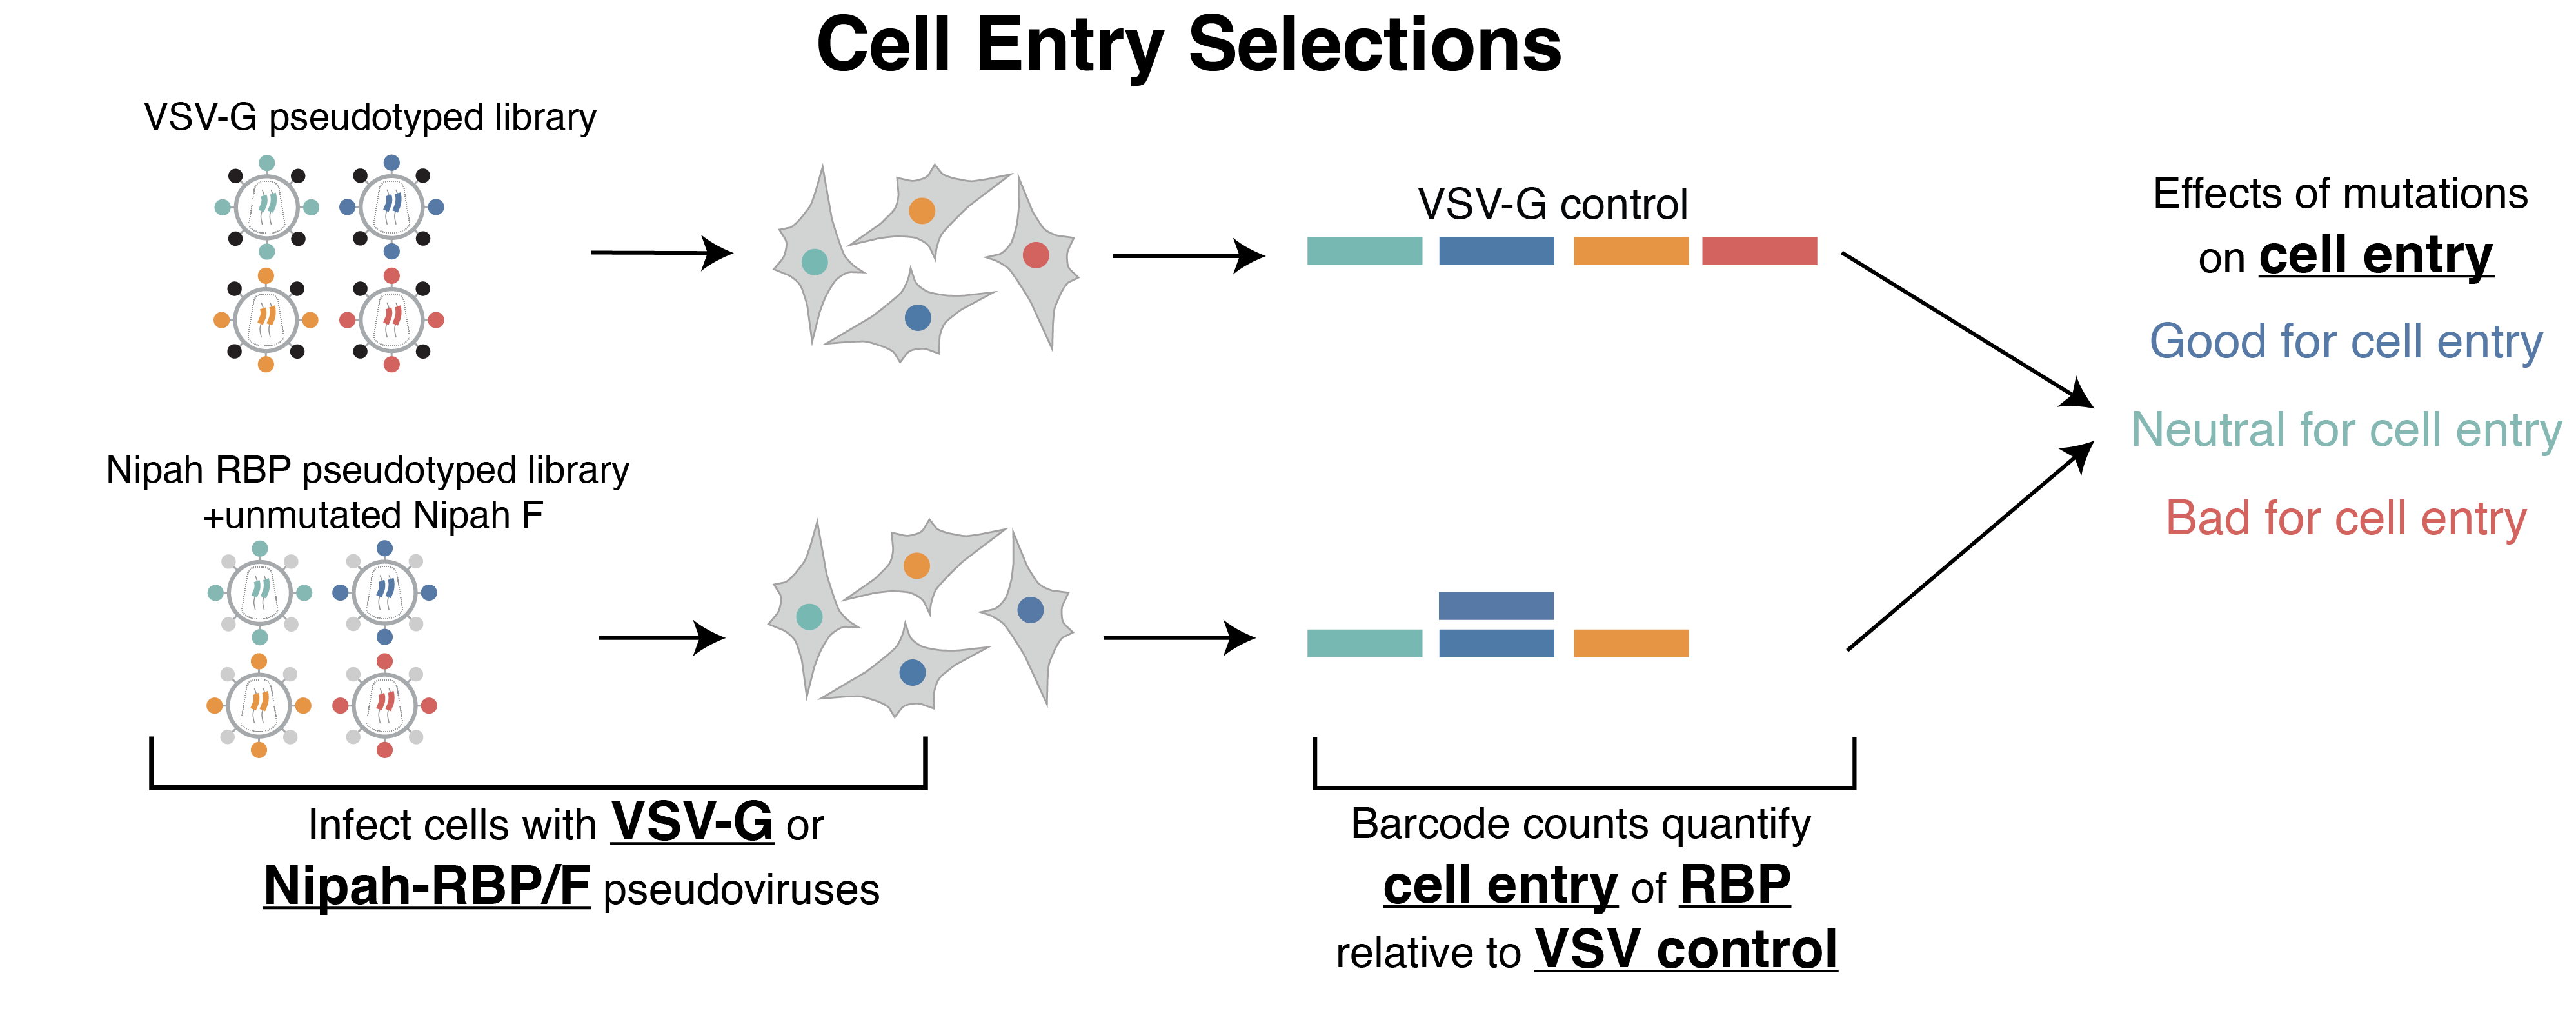
Cell Entry
To measure the effects of mutations on cell entry mediated by the receptor binding protein, we conducted 'functional selections'. In these selections, we compared the frequencies of specific barcodes between two groups of pseudoviruses: those expressing the Nipah virus receptor binding (mutated) and fusion proteins (unmutated), and those expressing VSV-G. Notebooks below contain information about each step.
Global Epistasis Fitting
Individual cell entry selections were fit with multidms to decompose the effects of individual mutations using a global epistasis model.
Individual functional selection global epistasis model fitting notebooks
LibB-230906-CHO-EFNB3-C6_diffVSV
LibB-230907-CHO-EFNB3-C6-nac_diffVSV
LibB-231105-CHO-EFNB2-BA6-nac_diffVSV
LibB-231108-CHO-EFNB2-BA6-nac_diff_VSV
LibB-231108-CHO-EFNB3-C6-nac_diff_VSV
LibB-231116-CHO-BA6_nac_diff_VSV
Averaging Cell Entry
Individual functional selections were averaged between libraries and replicates below.
Notebook averaging the effects of cell entry in CHO-bEFNB2 cells
Notebook averaging the effects of cell entry in CHO-bEFNB3 cells
Comprehensive Cell Entry Heatmaps
Additional control over filtering parameters. Users can adjust different parameters to filter the heatmap data. These provide more information and control compared to the final filtered heatmaps provided on the heatmaps page.
Functional Scores
Notebook analyzing the distribution of functional scores for all individual selections.
Analyze Data
Notebook analyzing cell entry from filtered data. Make figures for manuscript using python and altair.
Cell Entry Figures
TIP
Plots below are interactive. Hover over points to see more information. Click arrow box to view altair plots in separate page.
Site-averaged Effects of Mutations on Cell Entry
Cell Entry Correlations
Comparison of average effects of mutations on entry in cells expressing bat ephrin-B2 or bat ephrin-B3. Some mutations are much more tolerated for cell entry in bat ephrin-B2 cells, especially at sites near the receptor-binding interface.
Cell Entry Validations
To validate our deep mutational scanning measurements, we produced lentiviruses with individual mutations that spanned a range of effects. Cell entry validation notebook
Raw Data
These data have not been filtered. They are the raw output from dms-vep-pipeline-3. For filtered .csv files, click here
Averaged effects of RBP mutations on entry in CHO-bEFNB2 cells across replicates
Averaged effects of RBP mutations on entry in CHO-bEFNB3 cells across replicates